CANDLE RANGE THEORY · CRT
Read the flow, not the breakout.
Candle Range Theory (CRT) is a way of reading price that starts from a simple rule: when one candle fully liquidates another and price returns inside its range, the real intention is usually toward the opposite extreme. Forget chasing trends – learn to operate the return to balance.
No indicators, no smart-money jargon. Just pure range logic.
What is Candle Range Theory?
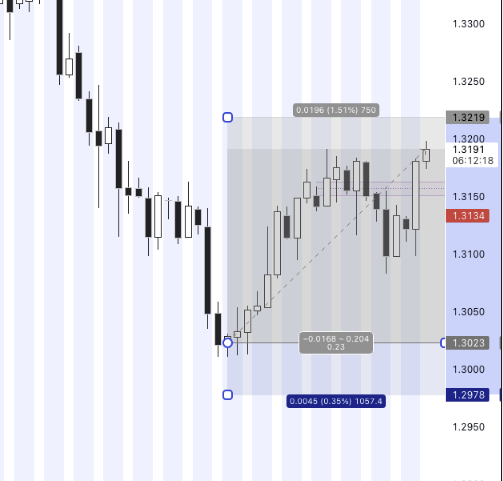
CRT is a framework to read price as a sequence of ranges that liquidate each other. When one candle wipes out another and price re-enters the previous range, the market is telling you which side has been emptied – and where the remaining liquidity still lives.
The simple rule that changes how you see the chart
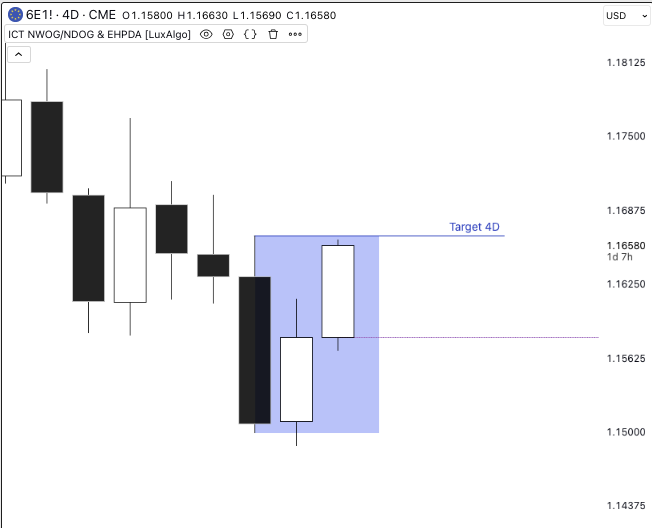
Most traders react to expansion. CRT focuses on what happens after the liquidation. When price returns inside the range of the candle it just cleaned, we assume that side is done: its liquidity has been eaten. From there, the path of least resistance usually points to the opposite extreme of that same candle.
- Liquidation: one candle takes the high or low of a previous candle.
- Re-entry: price closes back inside the old range.
- Direction: we project toward the untouched extreme.
This is not a “signal”. It is a way to organize the chart in your head: which side of the range has been emptied, and which side is still loaded.
The three pillars of CRT
1. Ranges over patterns
CRT doesn’t care about classical chart patterns. We track where ranges begin and end, which candle liquidates which, and how the market returns to balance.
2. Liquidity as the only story
Every move is judged by whose stops are being eaten. When a side is cleared and price steps back inside the prior range, we assume that side of the book is exhausted.
3. Direction from the opposite extreme
If a candle takes the high of the previous one and then price returns inside that range, our working hypothesis is simple: the next meaningful target is the low of the liquidated candle – and vice versa.
How you will learn CRT on this site
- Foundations of flow: short articles that reset how you think about markets and “freedom” in trading.
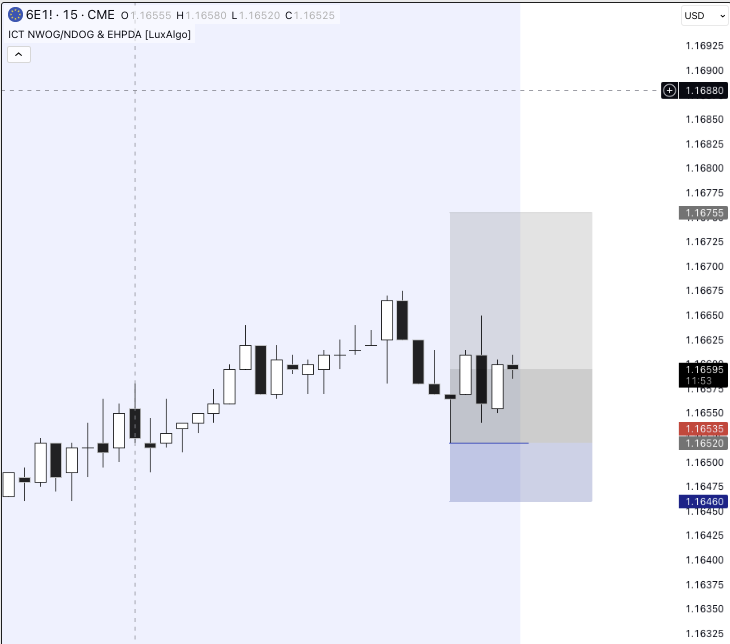
- Visual range breakdowns: step-by-step charts showing one candle liquidating another and the return into the range.
- Playbook examples: full sessions narrated candle by candle, focusing on the moment where direction flips toward the opposite extreme.
- Practice drills: screenshots where you must decide which range is active and which extreme is in play.
You do not need indicators, order-flow tools or institutional narratives. CRT is designed for a clean chart and a clear head.
About the CRT approach
Candle Range Theory was born from thousands of hours staring at naked charts, looking for one simple question: when does the market stop lying? The answer appeared every time a candle liquidated another one, price stepped back inside its range, and the move quietly continued toward the opposite extreme.
This site is not here to sell you a dream of freedom. It is here to give you a language for what the market actually does when it has finished hunting stops and is ready to breathe again.
Latest from the CRT journal
Short, dense pieces about range logic, liquidity and the psychology of being hunted by an algorithmic market.
Ready to stop chasing the candle that hunts you?
Join the CRT list and receive breakdowns of real sessions where one candle liquidates another, price steps back into the range, and the real move begins toward the opposite extreme. CRT Telegram Channel