The CRT candle openings table — The most accurate intraday timing tool (Forex & Futures)
The intraday truth nobody really talks about
If you’ve been trading for a while, you’ve probably heard things like:
- “London is about to move the market.”
- “New York brings the volatility.”
- “Be careful, a session is opening.”
All of that is true…
but it’s only a small part of the story.
Go to the CRT candle openings table
The real engine behind intraday movement isn’t the sessions.
It’s the opening of candles across all timeframes.
Yes — it’s that simple, and that powerful.
Every time the market opens a new candle (H1, H2, H4, H12…), the internal structure of price recalculates itself.
And whenever several candles open at the same time, the market hits a “pressure point” where:
- stops get cleared
- liquidity pools are taken
- ranges form
- reversals trigger
- strong continuations begin
This is exactly what the CRT Method (Candle Range Theory) is built upon.
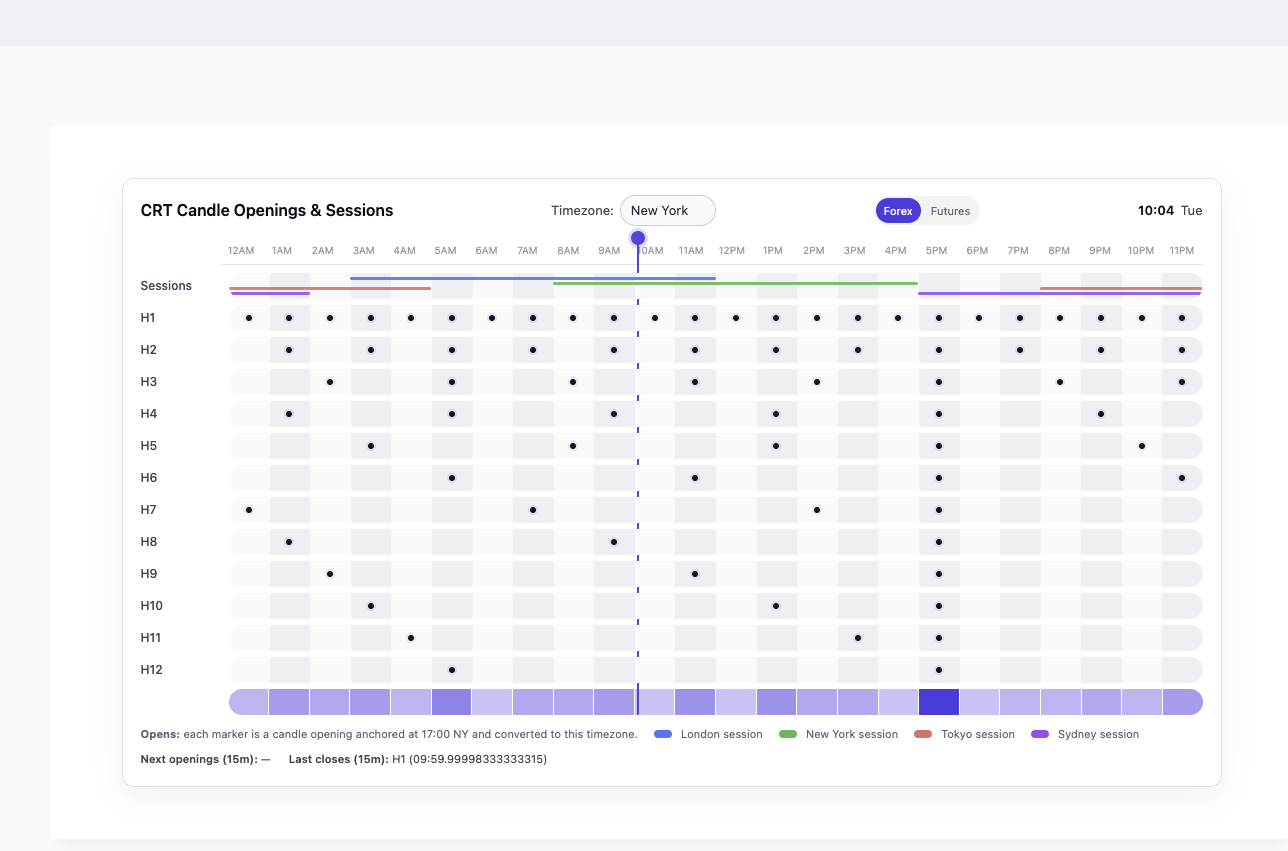
And this table shows you that timing in real time.
What this table actually shows you
Most platforms only display the opening of the timeframe you’re currently using.
But the market is running every timeframe simultaneously, each with its own schedule.
This table reveals:
- the opening times of H1 through H12
- all converted to your timezone
- a live vertical marker showing the current hour
- a heatmap highlighting when multiple timeframes open together
- next candle openings within 15 minutes
- recent closes from the last 15 minutes
- session overlays (London, NY, Tokyo, Sydney)
It’s basically the intraday heartbeat of the market.
With one look, you instantly know:
- when structure resets
- when volatility tends to appear
- when the market is preparing to move
- when to expect fakeouts, expansions or reversals
And once you start trading with this timing in mind, everything makes more sense.
Why candle openings actually move the market
Let’s break it down in normal language.
When a new candle opens, the market needs to:
- Start a fresh high–low range
- Evaluate direction
- Rebalance orders
- Redistribute liquidity
- Fill or leave inefficiencies
This happens every time, and at every timeframe.
Smaller TFs (H1–H3)
➡️ micro shifts, tiny sweeps, local liquidity grabs
Medium TFs (H4–H8)
➡️ session direction changes, volatility spikes
Big TFs (H12)
➡️ major rotations, reversals, session transitions
So when a bunch of these open at the same hour?
That’s when the market wakes up.
How CRT uses these candle openings
CRT is built on one observation:
When many candles open at the same time, a liquidity event almost always follows.
That event can be:
- a clean reversal
- a trend continuation
- a fake breakout
- or a range forming right before expansion
This is why the heatmap in your table is so important —
it visually marks the hours where price is statistically more likely to react.
Those are your high-probability windows.
How to actually use this in your trading
Here’s how CRT traders use this table every day:
✔️ Look for the hours where several timeframes open together
Those are prime moments for:
- strong wicks
- stop hunts
- range breaks
- sharp movements
✔️ Avoid entering right before a major opening
Price often whipsaws to clean liquidity.
✔️ Enter after the liquidity event completes
CRT thrives on trading after the sweep, not before it.
✔️ Use the heatmap as your volatility guide
The darker the hour → the more candles open → the more likely something meaningful happens.
✔️ Stop thinking in terms of “session opens”
London or New York don’t cause volatility by themselves.
Volatility comes from timeframe alignment and liquidity resets —
sessions just happen to overlap with those cycles.
Why this table becomes a core CRT tool
Because it reveals the market’s real rhythm — the one most traders never see:
- when liquidity resets
- when expansions begin
- when reversals tend to form
- when ranges are preparing to break
- when algorithms recalculate structure
This table removes the guesswork.
It gives you timing, clarity, and context — the things all traders need but rarely have.