[NASDAQ] Weekly outlook for the week of December 15 [CRT]
Let’s go with my second outlook for our beloved NASDAQ.
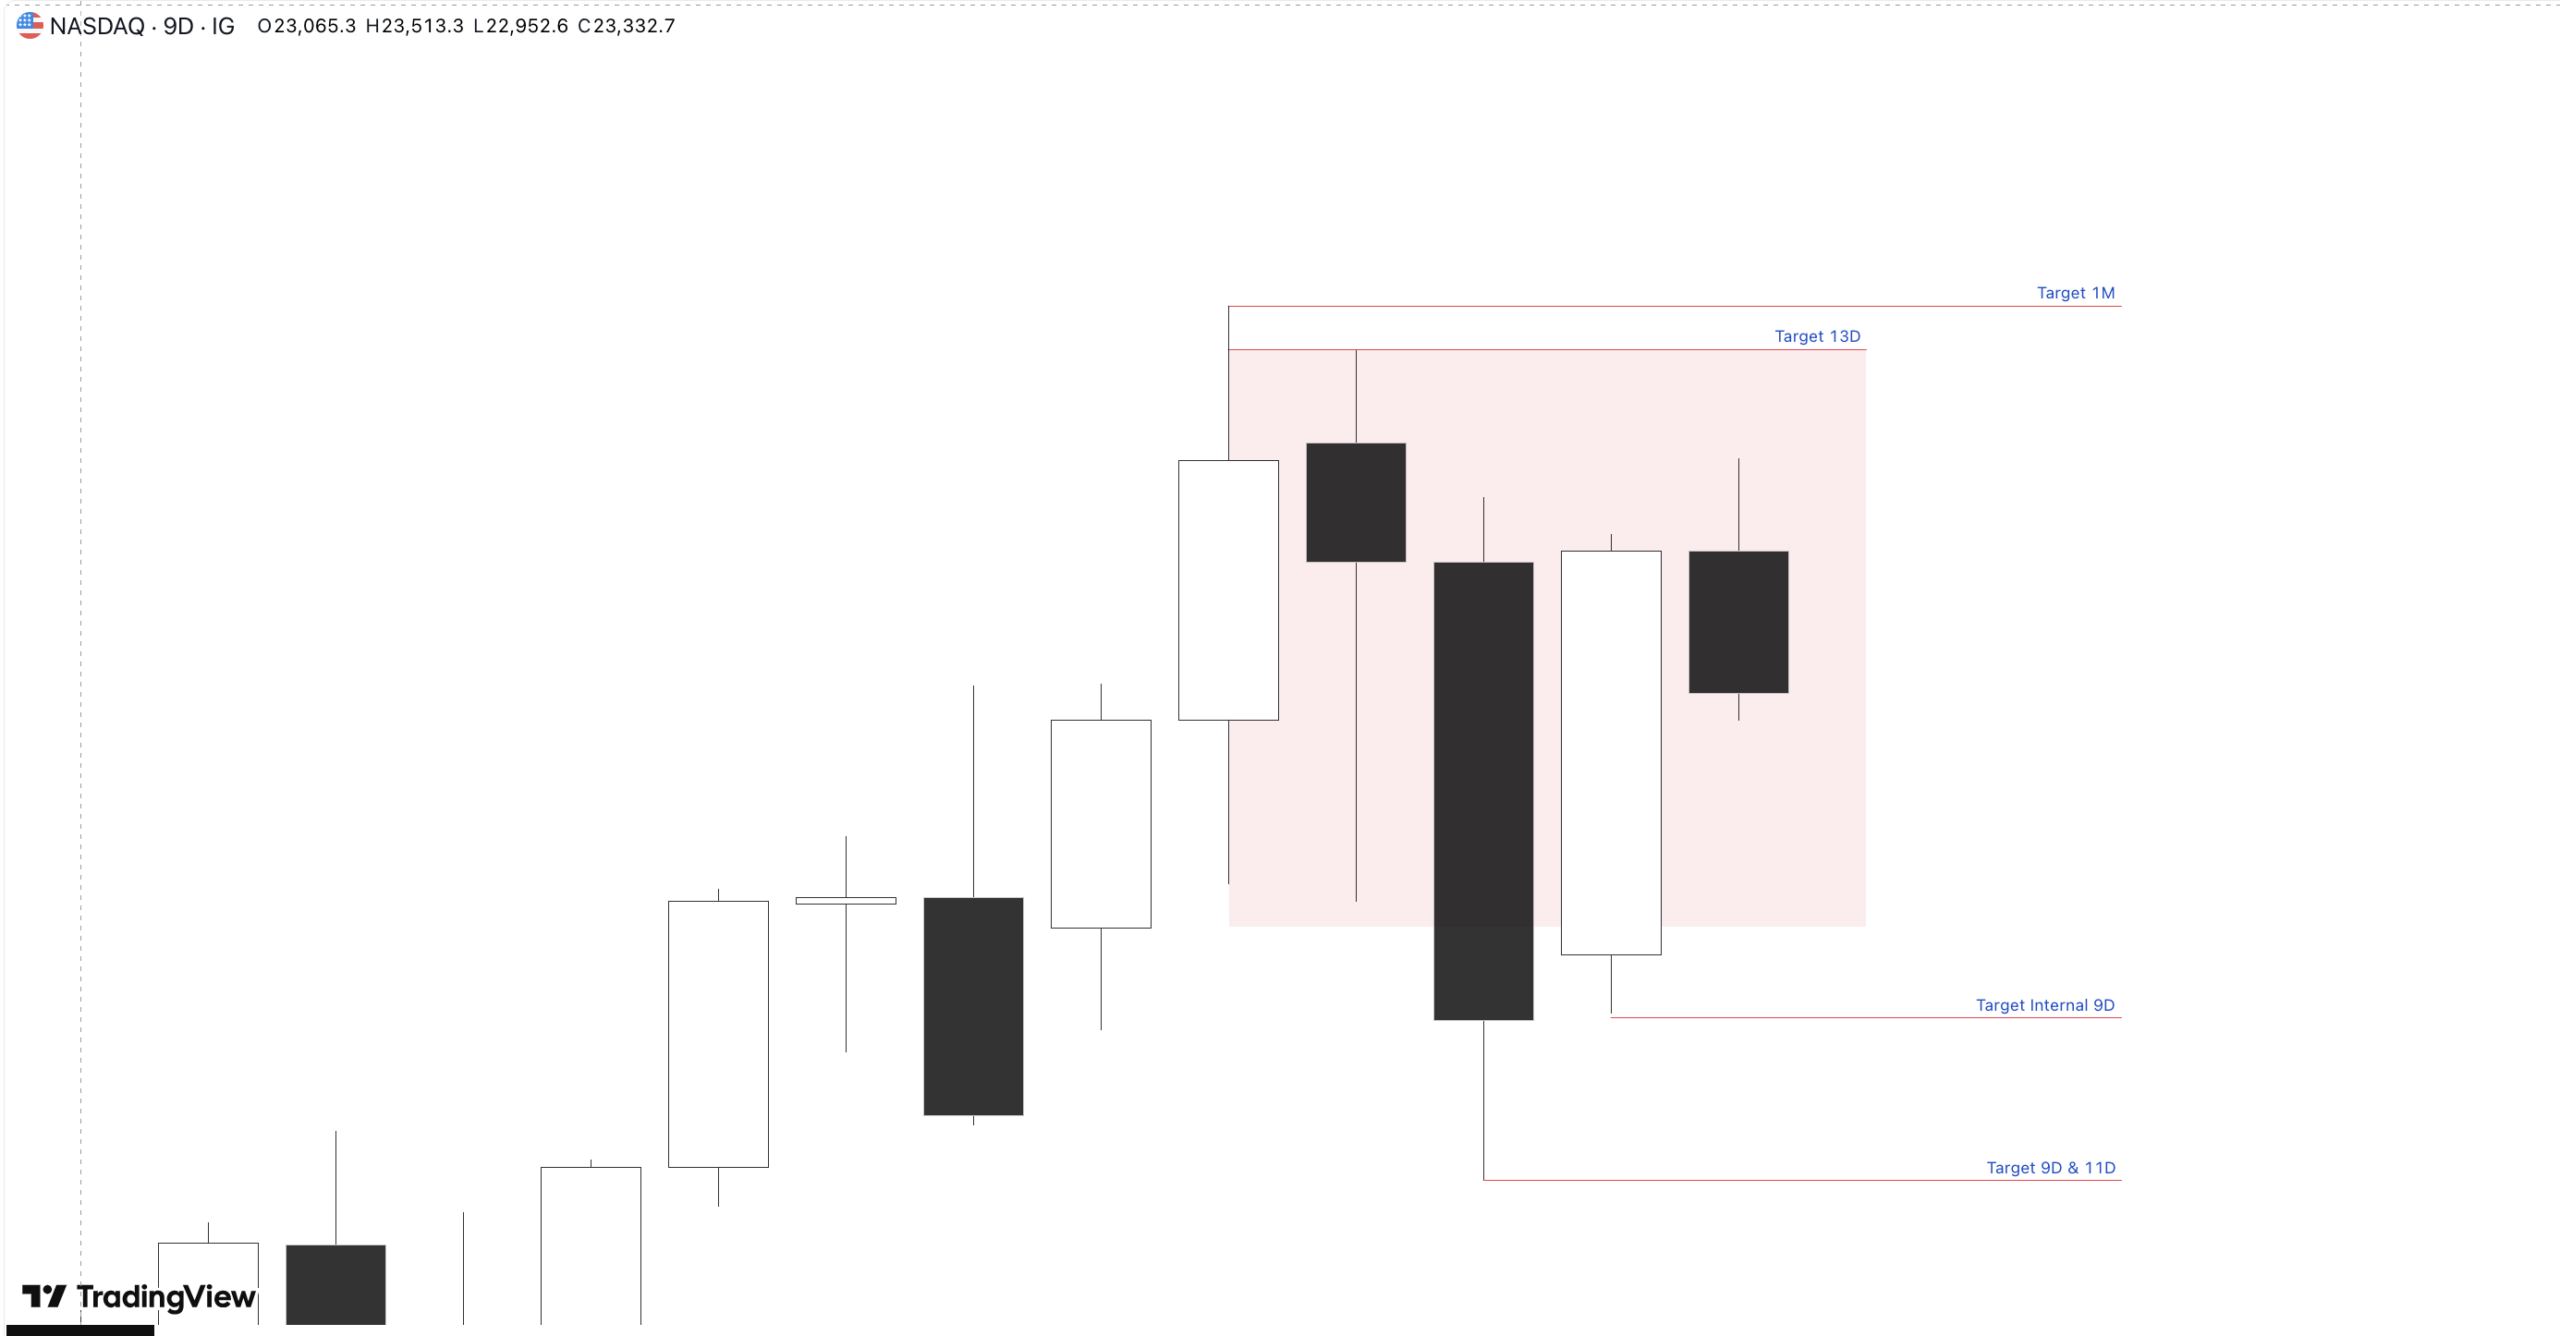
During last week we had marked as a target a range of 13 days that not only was not completed, but the price reacted by generating and confirming new bearish ranges, already with closed candles, specifically of 9 and 11 days.
With this context, next week we start with a clearly bearish bias towards those targets, at least until the market shows clear signs of invalidation.
However, it is important to remember that on a monthly timeframe we still have bullish targets active:
This does not imply that, from an intraday point of view, we should start looking for long positions under the CRT approach.
If we analyze in detail the price behavior during the previous week, we can hypothesize that the movement has only served to take liquidity at the highs, thus activating new bearish targets.
This scenario is seen more clearly when descending to the 9-day timeframe:
For now, looking ahead to the coming week, the plan is clear: prioritize shorts, at least until reaching the first 9D target or until the market builds new bullish ranges.
For those of us who trade intraday, and with the aim of reinforcing this bearish hypothesis, we first go down to the weekly timeframe:
In the NASDAQ weekly chart, it is seen how the last candle first liquidates through the upper part and then through the lower part, finally remaining trapped within the range of the candle corresponding to the week of December 1.
This behavior turns the candle of the week of December 8 into a low probability structure from the CRT model perspective.
We continue looking for algorithmic information, this time on the daily timeframe:
On the daily chart we do have a first defined target. The daily wick, in my opinion, is still not enough due to its temporal proximity; we will have to observe how the markets open.
The most common scenario would be an opening to the upside, generating a wick, then continuing with the bearish movement. If, on the contrary, the price first liquidates the low and returns to the range, we would consider it a red flag to look for sales, being more prudent to wait for the market to define itself more clearly.
Also, it should be taken into account that the SP500 shows long signals for Monday, so it is very likely that it will push the NASDAQ upwards initially. A good practice would be to let the SP500 capture those highs and, from there, look for short opportunities in NASDAQ:
In summary:
- New bearish targets have been activated on higher timeframes.
- On the weekly chart we do not have a clear scenario.
- On the daily chart we can consider sales, but we are very attentive to what happens on Monday, as it may completely change the context.
My main speculation for intraday remains to look for shorts until further notice.
That’s all for my second weekly outlook for NASDAQ. I hope it is useful to you.
![[EURUSD] Weekly projection for the week of December 15 [CRT]](https://candlerangetheory.com/wp-content/uploads/2025/12/EURUSD_2025-12-14_03-00-34-768x480.png)
![[CRT] Weekly EURUSD projection for the week of December 8](https://candlerangetheory.com/wp-content/uploads/2025/12/Captura-de-pantalla-2025-12-07-a-las-9.34.52-768x386.png)
![[NASDAQ] Weekly projection for the week of December 8 [CRT]](https://candlerangetheory.com/wp-content/uploads/2025/12/Captura-de-pantalla-2025-12-07-a-las-10.23.05-768x409.png)
![[CRT] Weekly projection for the EURUSD, week of December 1](https://candlerangetheory.com/wp-content/uploads/2025/11/EURUSD_2025-11-30_11-26-55-768x425.png)
![[CRT] Early-Week Projection for EURUSD – Week of November 24](https://candlerangetheory.com/wp-content/uploads/2025/11/EURUSD_2025-11-23_05-21-02-768x371.png)