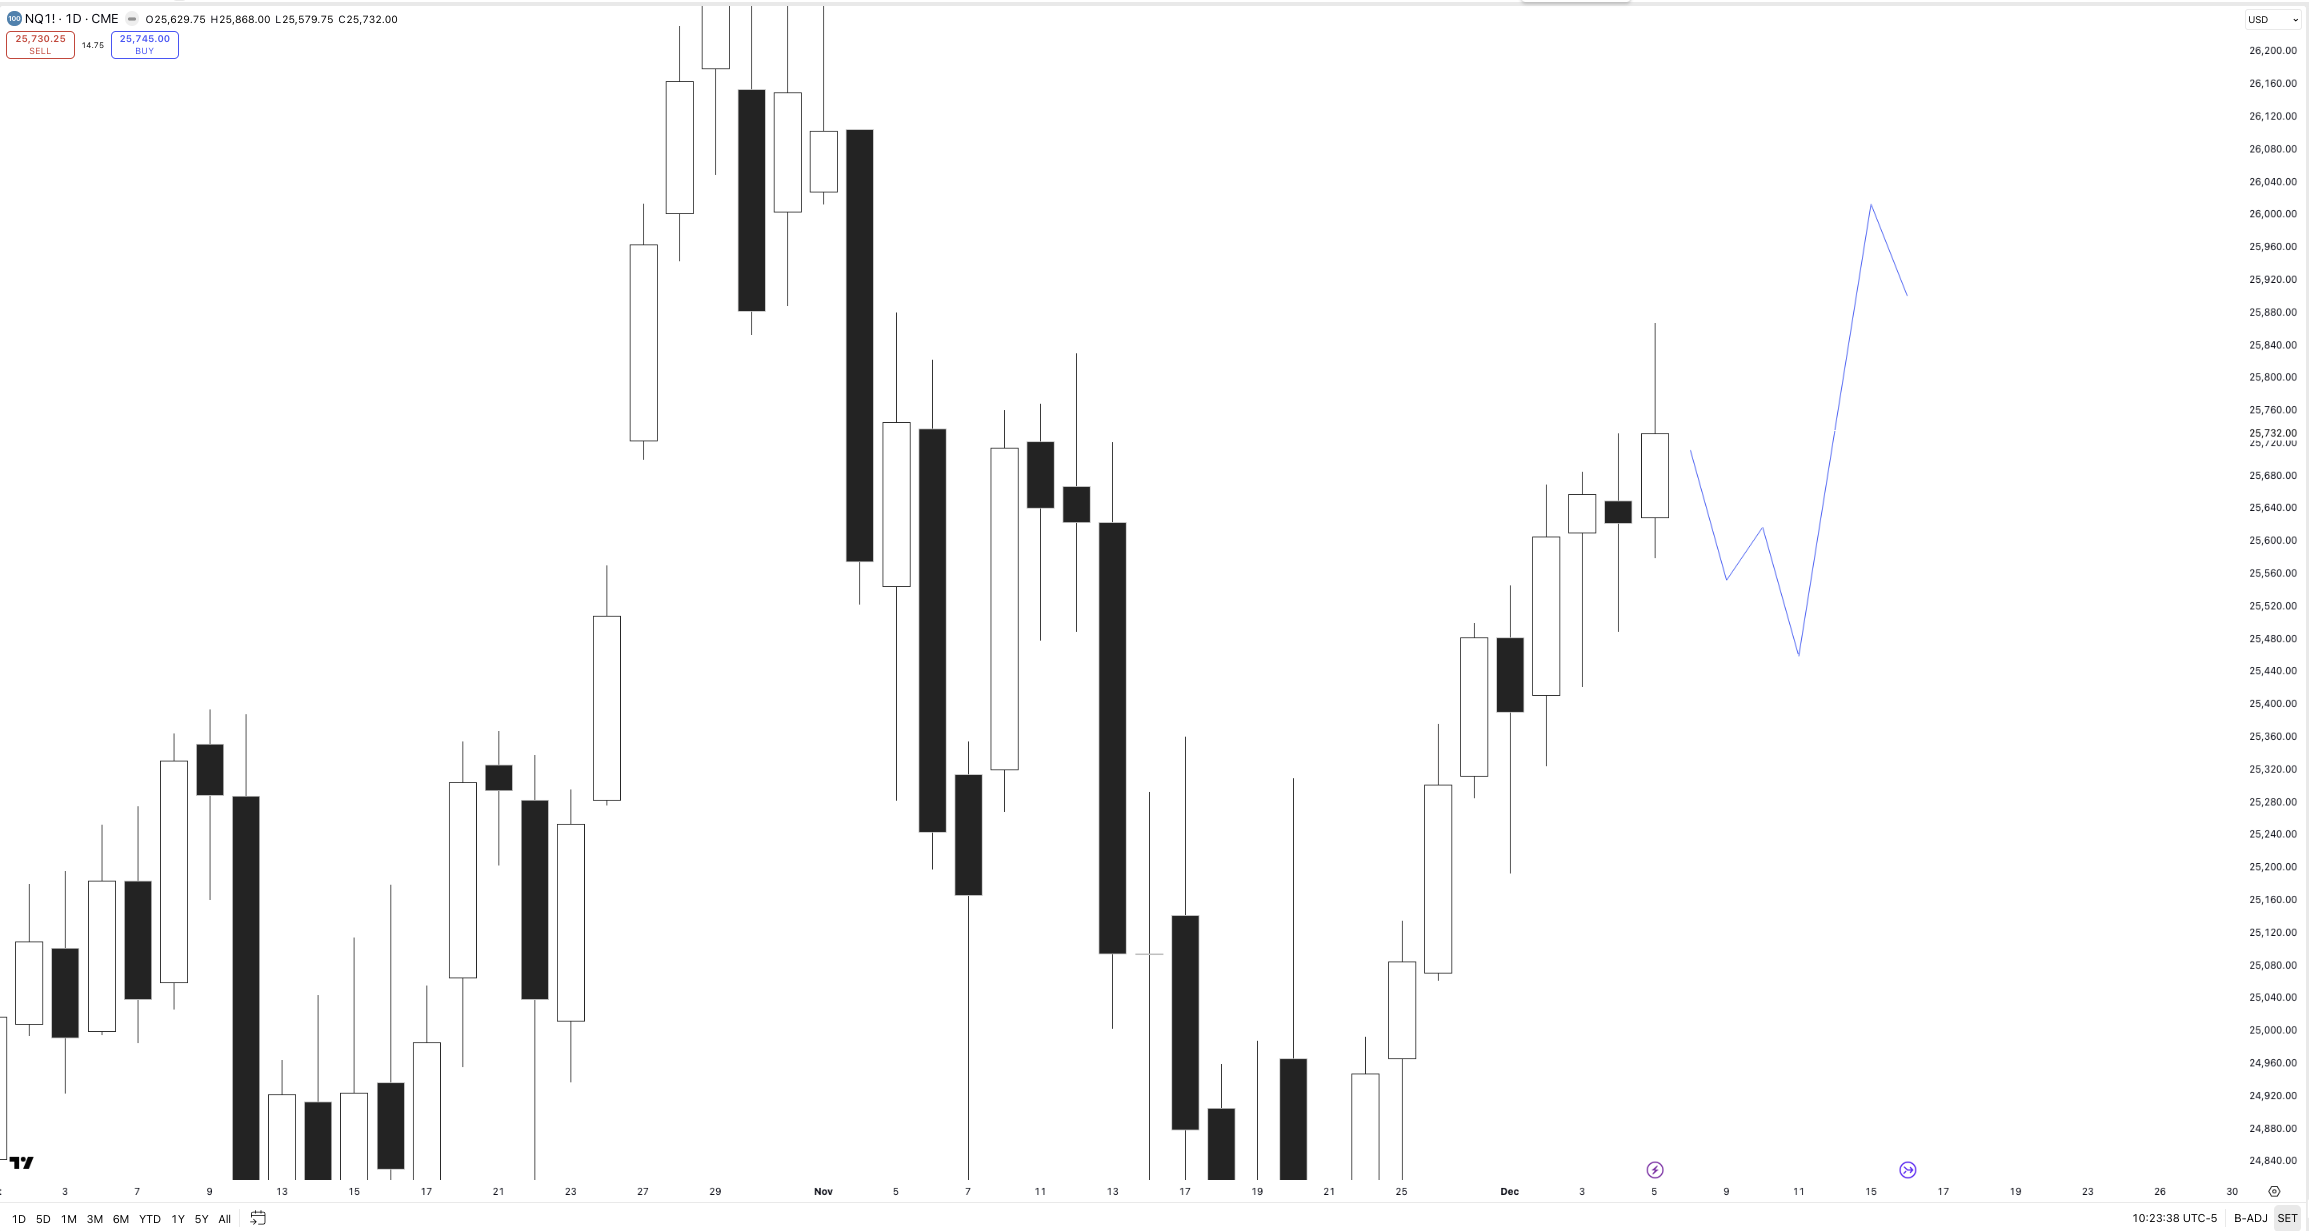
[NASDAQ] Weekly projection for the week of December 8 [CRT]
Let’s take a look at the NASDAQ from the CRT perspective. To be transparent, I don’t usually work much with indices; I have only recently started trading them, but at some point, you have to take the first step.
To have a global view, we start with the monthly timeframe: in November, the price settled at October’s low and closed within its range. This keeps us, for now, in a
bullish context towards possible new all-time highs (something quite common in equities when looking at the monthly chart).
If we zoom in on the 13-day timeframe, a range that has not yet been completed is clearly visible, so we can mark a first target to consider:
Next, we go down to the weekly chart to review how the last candle closed:
Here we see that the week closed with the body above the previous week’s high and also left a wick at the top. This information already gives us an interesting clue for
intraday trading: we can start to consider long scenarios for Monday, at least up to the area of that recent high.
If we move to the daily chart, in the broker we were following on Friday it seems to close slightly above the previous day. However, since the difference is minimal, it is better to check in
futures. Doing so, we confirm that on Friday it actually closes within Thursday’s range; by very little, but it remains contained within that candle:
With all this on the table, for this Monday we have signals for both possible longs and shorts, unlike what happens with
the European currencies, where the scenario is clearer. This, from the CRT point of view, leaves us with a
low probability scenario.
In my case, the most cautious approach would be to wait for the price on Monday to first settle the Thursday low and, if that happens, then look to enter on buys. And if the price decides
to start directly upwards without sweeping that low, simply accept that we miss the move and wait for a clearer context.
I wish you a very profitable start to the week and many profits!
![[CRT] Weekly projection for the EURUSD, week of December 1](https://candlerangetheory.com/wp-content/uploads/2025/11/EURUSD_2025-11-30_11-26-55-768x425.png)
![[CRT] Weekly EURUSD projection for the week of December 8](https://candlerangetheory.com/wp-content/uploads/2025/12/Captura-de-pantalla-2025-12-07-a-las-9.34.52-768x386.png)
![[NASDAQ] Weekly outlook for the week of December 15 [CRT]](https://candlerangetheory.com/wp-content/uploads/2025/12/Captura-de-pantalla-2025-12-14-a-las-2.53.47-768x401.png)
![[CRT] Early-Week Projection for EURUSD – Week of November 24](https://candlerangetheory.com/wp-content/uploads/2025/11/EURUSD_2025-11-23_05-21-02-768x371.png)
![[EURUSD] Weekly projection for the week of December 15 [CRT]](https://candlerangetheory.com/wp-content/uploads/2025/12/EURUSD_2025-12-14_03-00-34-768x480.png)